Proxmox telemetry via Influxdb and Chronograf
Note :
This won’t currently work if you’re running the InfluxDB server as a Home Assistant addin. The config there doesn’t support it and has been ruled out as a change for the time being - see this link for an explanation.
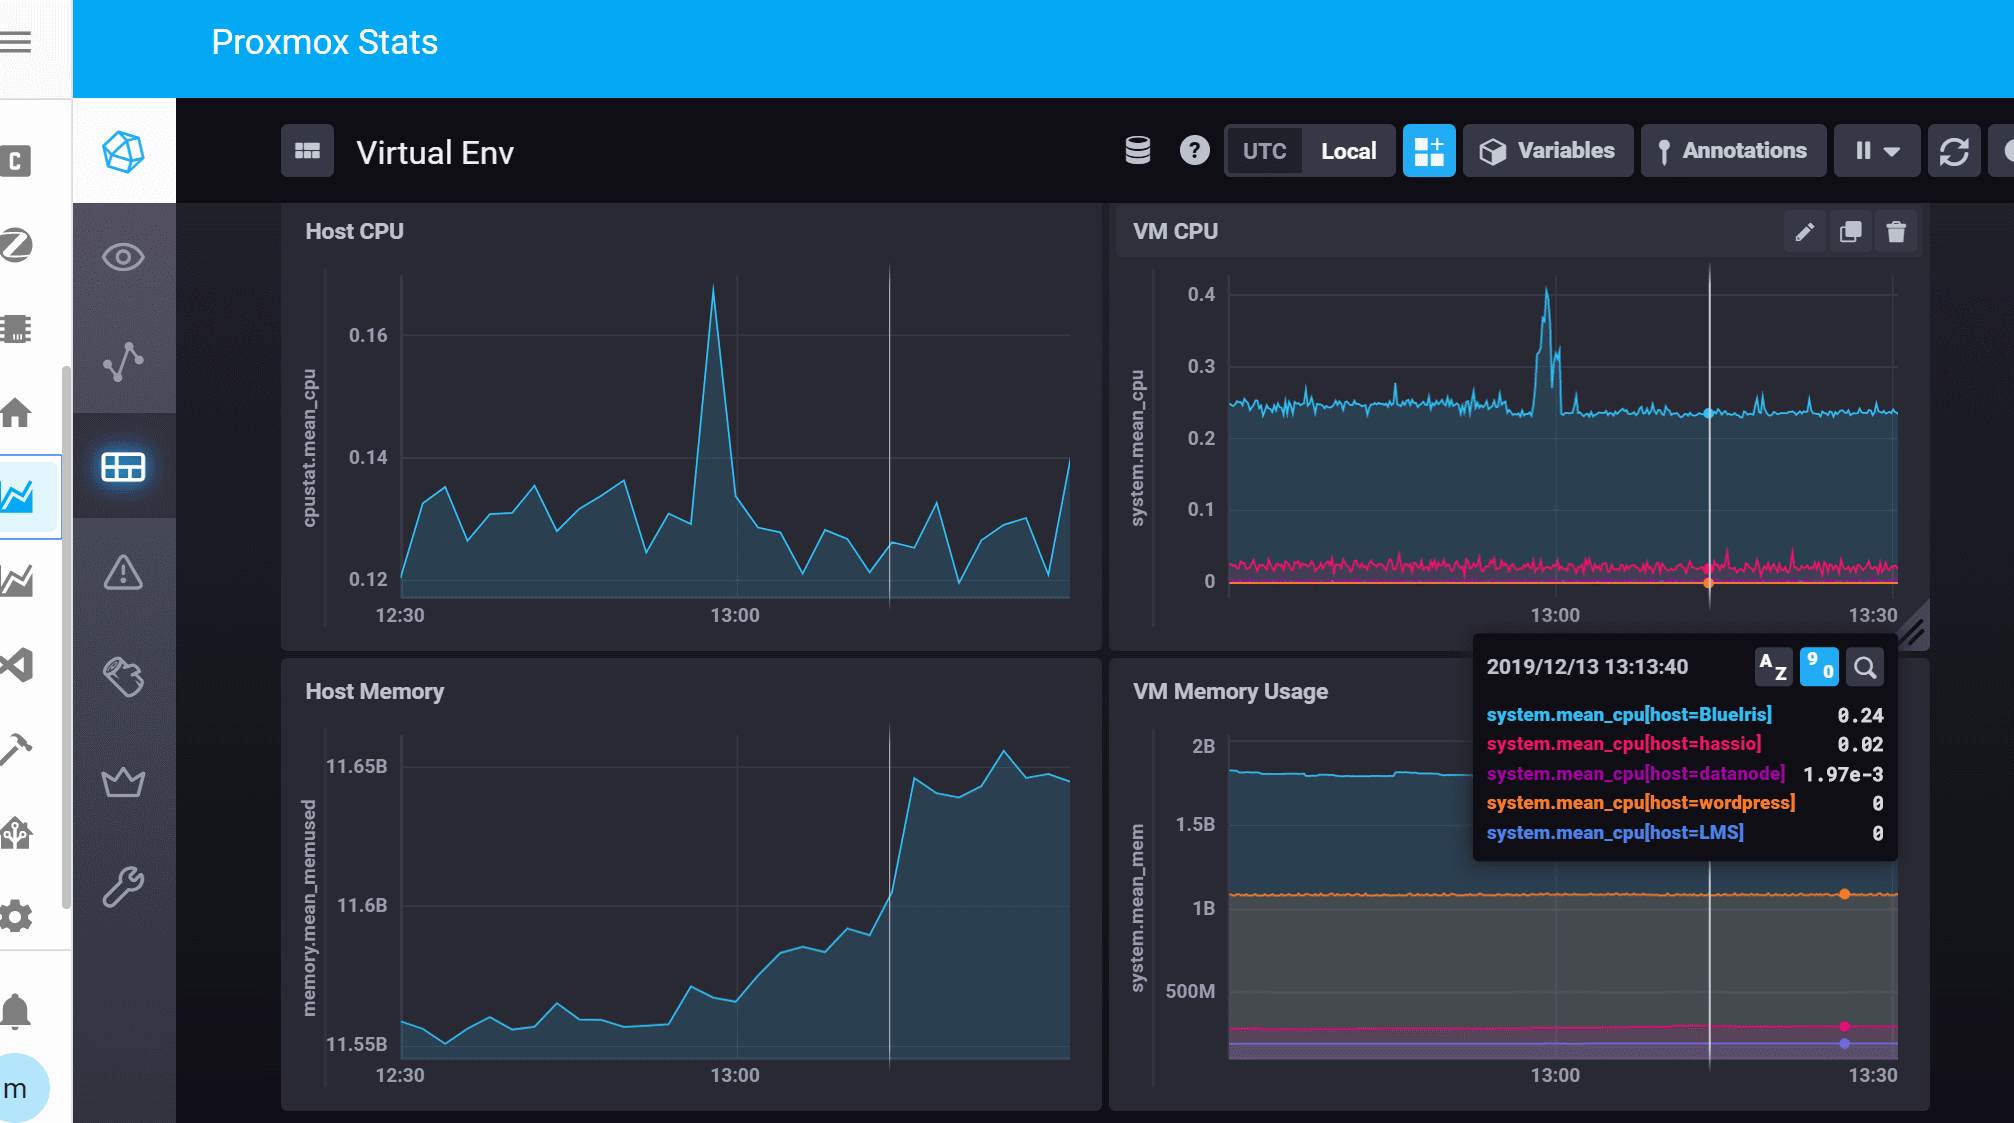
I wanted to get some telemetry data from my Proxmox instance - primarily so I could make sure there were no times of the day or week where I was unduly stressing the machine. To achieve this I spent a few minutes configuring the server to log telemetry data to InfluxDB. Surprisingly, it was relatively simple to do.
Pre-requisites
I have an influx database running in it’s own container on the Proxmox server. If you don’t then either set it up, or make sure you can configure the hassio plugin. I didn’t verify that step since I don’t use it.
Method
Proxmox Configuration
On the proxmox node open a console, and type
nano /etc/pve/status.cfg
You’ll probably get a warning that you’re creating a new file. That’s OK - you probably need to as by default the file doesn’t exist.
Enter the following in the file
influxdb:
  server 192.168.3.3
  port 8089
Remember to replace the IP and port numbers to match your own network!!!
See https://pve.proxmox.com/wiki/External_Metric_Server for details
InfluxDB setup
You’ll need to open a UDP port for the telemetry data. Proxmox doesn’t use other protocols for this so you have no choice.
On your influxDB server, edit the config file
nano /etc/influxdb/influxdb.conf
and find the section that controls UDP access. This has a header of [[UDP]]
make sure the section looks like the following. You’ll need to change a few things from the defaults.
[[udp]]
   enabled = true
   bind-address = "0.0.0.0:8089"
   database = "proxmox"
   batch-size = 1000
   batch-timeout = "1s"
The database name should be proxmox, as above.
Now save and exit the file and restart Influx with
service influxdb restart
That’s it. Telemetry should start to flow into InfluxDB. After that you can set up some reporting in Grafana or Chronograf and be happy.